


Platform revenue forecasting is where connectivity habits cause the most damage to a sales leader’s credibility. A connectivity contract signed at a fixed monthly fee is close to perfectly predictable once it is live. A consumption-based or ramp-priced platform contract is not: the signed value is a floor, actual revenue depends on usage, and the timing of ramp steps depends on adoption milestones the customer controls.
Forecasting both kinds of revenue with the same method produces one of two errors: overstated forecasts, when ramp and consumption upside are counted as certain, or understated ones, when platform deals are recorded only at their committed floor and real usage growth never shows up in the plan. This module builds on the pricing models in Module 2 and the qualification scoring in Module 7.
A connectivity forecast predicts what was signed. A platform forecast has to predict what will be used.
Why connectivity methods break platform revenue forecasting
| Factor | Connectivity revenue | Platform revenue |
| Contract value | Equals expected revenue | Sets a floor; actual revenue varies |
| Timing | Starts at service activation | Ramp steps depend on customer adoption |
| Variance | Low, mostly from churn | High, from usage, adoption pace, and seasonality |
| Upside | Only from new orders | From usage growth on existing contracts |
The four-layer forecast model
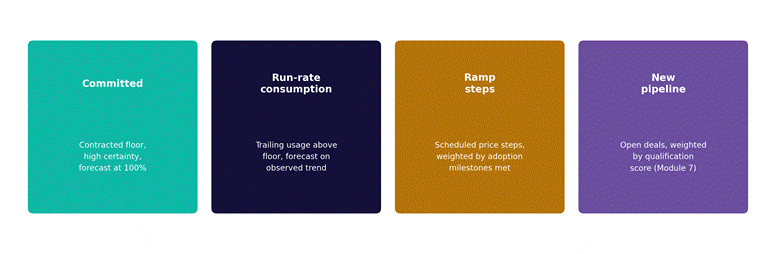
Figure 1. Four layers, each forecast with a different method and confidence level, then summed.
| Layer | Forecast method | Typical confidence |
| Committed | Contracted floors and fixed fees on live services | Treat as certain, adjusted only for known churn risk |
| Run-rate consumption | Trailing three-month usage above the floor, projected on its observed trend | Moderate; reduce for seasonal accounts |
| Ramp steps | Scheduled price steps, counted only when the adoption milestone triggering them is on track | Weighted by milestone status, not by contract schedule |
| New pipeline | Open opportunities weighted by Module 7 qualification score | Lowest; the layer most exposed to slippage |
Weighting new pipeline by qualification, not stage
Many teams weight pipeline by sales stage alone. For platform deals, stage is a weak signal, because a deal can reach proposal stage with no confirmed budget holder. Weighting by the Module 7 score is more honest:
| Qualification score (of 8) | Suggested weight | Rationale |
| 7 to 8 | 70 to 80% | All four BANT elements confirmed |
| 5 to 6 | 40 to 50% | One element still open, usually Authority or Timeline |
| 3 to 4 | 15 to 25% | Real need, but unfunded or unscheduled |
| Below 3 | Exclude from forecast | Watch list, not pipeline |
These weights are a starting point. Replace them with the team’s own historical conversion by score band once a few quarters of data exist.
Worked example
A team leader forecasts the quarter by adding up the full contract value of every signed platform deal plus stage-weighted pipeline. The result comes in well above what is delivered for two quarters running.
- Split signed revenue into layers. Of the signed platform value, only the floors are truly committed. The rest had been counted as if consumption would hit contracted maximums immediately.
- Check ramp milestones. Two large deals had ramp steps scheduled for this quarter, but neither customer had completed the adoption milestone that triggers them. Those steps move to next quarter.
- Reweight pipeline by qualification. Several opportunities at proposal stage score only 3 or 4 on BANT, because Authority was never confirmed (the gap Module 8 addresses). Their weight drops sharply.
- Result. The revised forecast is lower, but it lands within a few percent of actual revenue at quarter end. Leadership’s confidence in the number rises, which matters more over time than a larger figure that is repeatedly missed.
What comes next
Module 15 turns from numbers to people: how to coach KAMs through the shift from order-taker to technical consultant, which, together with the team structure in Module 13, is what ultimately drives every layer of this forecast.
In your current forecast, how much of the platform number is committed floor, and how much is assumed usage that has not yet happened?