

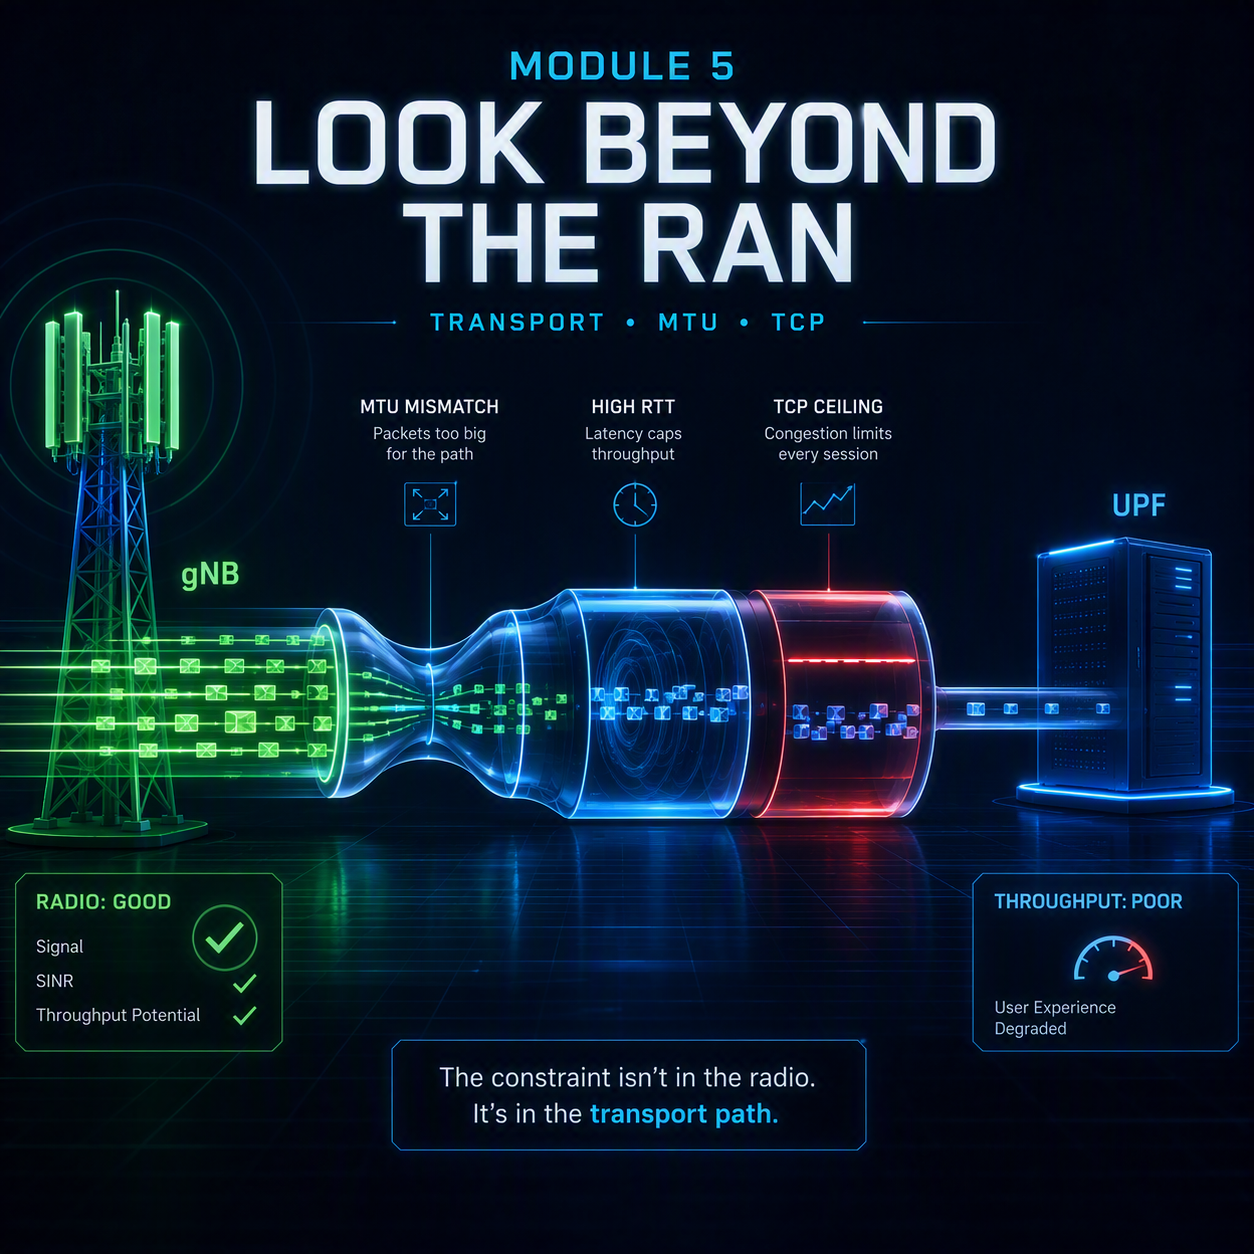
5G transport troubleshooting begins where Module 4 ended: the radio has been proven healthy, and throughput is still poor. This is the point at which most investigations stall, because the engineer holding the ticket owns the radio and the constraint sits on a path they cannot see from any RAN dashboard.
The transport network between the gNB and the UPF is ordinary IP infrastructure, and it fails in ordinary ways — a port negotiating at the wrong speed, a maximum transmission unit that nobody adjusted for tunnel overhead, a round-trip time that quietly caps every TCP session on the path. None of these appear as a radio problem. All of them present as one.
The radio can be perfect and the session still slow. Transport failures are invisible to every counter the RAN produces.
In this module
- Part 1 — What 5G transport troubleshooting actually covers
- Part 2 — Interface speed and duplex: the silent ceiling
- Part 3 — MTU, GTP-U overhead and fragmentation
- Part 4 — Latency and the TCP window
- Part 5 — Packet loss and why a tiny number matters
- Part 6 — Buffering, bufferbloat and the QoS interaction
- Part 7 — How to test the transport path properly
- Part 8 — Counters and where to look in 5G transport troubleshooting
- Part 9 — Worked example
- Part 10 — The full decision tree
Part 1 — What 5G transport troubleshooting actually covers
The transport path is everything between the radio and the internet breakout. On a modern network that is more hops than most radio engineers realize, and every one of them can independently negotiate a speed, enforce an MTU, queue packets and drop them.
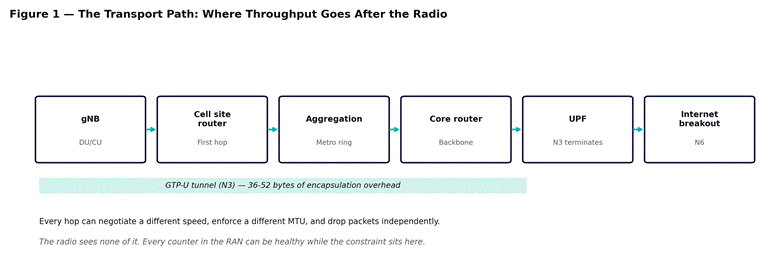
Figure 1 — the path a packet takes after the radio. The GTP-U tunnel spans most of it and adds overhead the endpoints never see.
Two properties of this path matter more than the rest.
First, it is tunneled. User traffic between the gNB and the UPF travels inside GTP-U, which wraps every packet in an outer IP header, a UDP header and a GTP header. That overhead is invisible to the UE and to the application server, both of which behave as though they are on an ordinary network.
Second, it is shared and heterogeneous. A cell site router, a metro aggregation ring and a core backbone are typically different equipment under different teams, possibly different vendors, and often with different configuration standards. A mismatch at any one of them constrains the whole path.
The tunnel itself is set up during PDU session establishment, and the N4 exchange that installs the forwarding rules is covered in Module 1 of this course. If the division of labor between control and user plane is unfamiliar, control and user plane separation explains why the transport path can fail while every signaling procedure completes successfully.
Part 2 — Interface speed and duplex: the silent ceiling
The simplest transport fault is also the most common and the least glamorous. An interface somewhere on the path has negotiated at a lower speed than it should, or has settled into half duplex, and everything behind it is capped.
Why it happens
- Auto-negotiation failed and both ends fell back to a safe default. This is the classic case and it produces a hard, unchanging ceiling.
- One end is hard-coded and the other is set to auto. Auto-negotiation requires both ends to participate; when one does not, the other guesses, and it frequently guesses half duplex.
- A cable or optic was replaced during maintenance and the new one does not support the previous rate.
- A port was moved to a different card or switch during a site visit and nobody re-checked the configuration.
The signature
A speed or duplex problem produces a throughput figure that is stubbornly identical at every hour of the day and under every radio condition. It does not scale with load, it does not improve at three in the morning, and it does not respond to any radio change. If a site delivers exactly the same disappointing number regardless of circumstances, check the interfaces before anything else.
Duplex mismatches add a second signature: late collisions and CRC errors on the interface counters. A speed mismatch alone may show no errors at all, which is why the counter check and the configuration check are separate steps. Note that in a disaggregated RAN the first hop may be fronthaul rather than backhaul, with far tighter latency and capacity requirements — the CU/DU/RU split determines which segment you are actually looking at.
Triage steps
- Walk the path hop by hop and record the negotiated speed and duplex on both ends of every link. Both ends — a mismatch is only visible when you compare them.
- Check interface error counters at each hop: CRC errors, late collisions, input and output drops. Reset them and re-check after an hour to get a rate rather than a lifetime total.
- Compare the negotiated rate against the port’s configured rate. A port configured for 10G that negotiated 1G is the finding.
- Correlate the start of the problem against any recorded site visit or maintenance window. This fault is almost always introduced by hands on equipment.
A throughput figure that never changes — not with load, not with time of day, not with radio conditions — is a negotiated interface rate until proven otherwise.
Part 3 — MTU, GTP-U overhead and fragmentation
This is the transport fault that produces the strangest symptoms and the one most likely to be misattributed to the radio, because it does not affect all traffic equally. Small packets pass cleanly. Large ones do not.
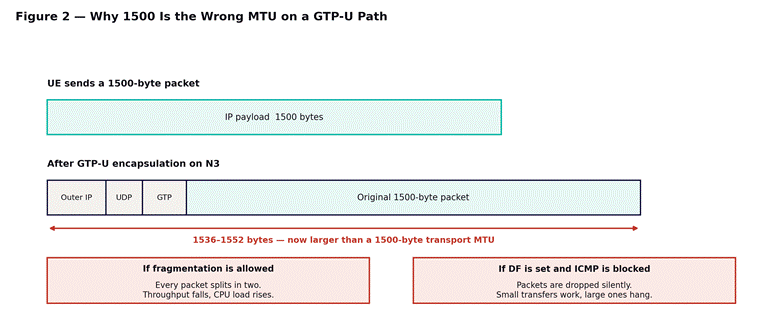
Figure 2 — GTP-U adds 36 to 52 bytes. A 1500-byte payload no longer fits inside a 1500-byte transport MTU.
The mechanism
The UE and the application server both assume a 1500-byte maximum transmission unit, because that is the Ethernet default and nothing in their view of the network suggests otherwise. When a full-size packet enters the GTP-U tunnel, the outer IP header, UDP header and GTP header are added. The encapsulated packet is now roughly 1536 to 1552 bytes depending on the IP version and whether extension headers are present.
If the transport network between the gNB and the UPF also has a 1500-byte MTU, that packet no longer fits. Two things can happen, and both are bad.
| Condition | What happens | Symptom |
| Fragmentation permitted | Every full-size packet is split in two | Throughput drops, router CPU rises, reassembly load at the far end |
| DF bit set, ICMP allowed | Sender is told to reduce packet size | Path MTU discovery works; usually invisible and fine |
| DF bit set, ICMP blocked | Packets are dropped with no notification | The black hole — small transfers work, large ones hang forever |
The black hole case
The third row deserves its own attention because it produces the single most confusing symptom in transport troubleshooting. Path MTU discovery depends on ICMP “fragmentation needed” messages reaching the sender. Many networks block ICMP as a matter of policy. When they do, the sender never learns its packets are too large, and simply retransmits them forever.
The user experience is distinctive: a browser loads a page header and then hangs. A ping succeeds. A small file downloads instantly. A large file starts and stalls at a few kilobytes. An engineer testing with ping and a quick speed test may see nothing wrong at all.
Triage steps
- Test the actual path MTU with fragmentation disabled, increasing the payload size until packets stop returning. The largest size that succeeds, plus header overhead, is your real path MTU.
- Compare that against the configured MTU on every hop. The smallest value on the path is the one that governs.
- Check whether the transport network is configured for jumbo frames. The correct fix is usually to raise the transport MTU to 1600 or above so the encapsulated packet fits without fragmentation.
- If raising the transport MTU is not possible, lower the MTU advertised to the UE so the encapsulated packet stays under the limit. This is the workaround, not the fix.
- Verify ICMP is not being filtered on the path. Blocking it converts a manageable MTU mismatch into a silent black hole.
Part 4 — Latency and the TCP window
A transport path can have no errors, no loss and correct MTU, and still cap throughput severely. Latency alone does it, and the mechanism catches out engineers who reasonably assume that a clean link means an unconstrained one.
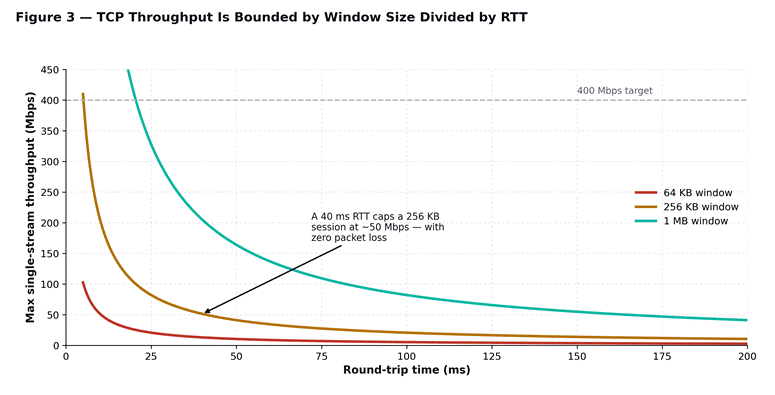
Figure 3 — single-stream TCP throughput against round-trip time. The ceiling is window size divided by RTT, regardless of link capacity.
The relationship
TCP sends a window of data and waits for acknowledgement before sending more. The maximum a single session can achieve is therefore the window size divided by the round-trip time. This is the bandwidth-delay product, and it is a hard ceiling that has nothing to do with how much capacity the link has.
The consequences are counterintuitive. A 40 millisecond round trip caps a session with a 256 kilobyte window at roughly 50 Mbps — on a link capable of gigabit, with zero packet loss and a perfectly healthy radio. Doubling the link capacity changes nothing. Halving the latency doubles the throughput.
| Latency source | Typical contribution | What to do about it |
| Radio scheduling | 1–10 ms | Little — this is inherent to the air interface |
| Transport propagation | 0.5 ms per 100 km of fiber | Nothing; physics |
| Queuing at congested hops | Highly variable, can dominate | Fix congestion or queue management |
| Distant UPF anchoring | 10–50 ms if anchored far away | Anchor the session to a closer UPF |
| Server distance | Often the largest single component | Nothing under operator control |
Why the UPF row matters most
Of everything in that table, UPF anchoring is the one an operator controls and the one most often wrong. A session anchored to a UPF in a distant data center adds latency to every packet in both directions, and because the effect is a throughput ceiling rather than an outage, it is rarely investigated. A customer in one city whose traffic is anchored three hundred kilometers away will report poor throughput that no radio work can fix.
Which UPF a session lands on is an SMF selection decision made during PDU session establishment — the AMF, SMF and UPF breakdown covers how that choice is made, and network slicing covers how slice configuration can constrain which UPFs are eligible in the first place.
Triage steps
- Measure round-trip time to the UPF, then separately to the internet breakout, then to the actual destination server. Three separate numbers — the increments tell you where latency accumulates.
- Calculate the theoretical single-stream ceiling from the measured RTT and the client’s window size. If observed throughput is close to that figure, latency is your constraint and nothing else needs investigating.
- Test with multiple parallel streams. If aggregate throughput scales linearly with stream count, the single-stream window is the limit — not the link.
- Check which UPF the session is anchored to and how far away it is.
Part 5 — Packet loss and why a tiny number matters
Packet loss on a transport path damages TCP throughput out of all proportion to its size. A loss rate that looks negligible on a summary dashboard can halve throughput, and engineers routinely dismiss it for exactly that reason.
TCP interprets loss as congestion and reduces its sending rate in response. On a long path, recovering from each loss event takes many round trips. The result is that throughput degrades roughly with the square root of the loss rate divided by the round-trip time — which means loss and latency compound. A tenth of a percent loss on a short path is survivable. The same rate on a long path is severe.
| Loss rate | On a 20 ms path | On a 100 ms path |
| 0.01% | Barely noticeable | Measurable reduction |
| 0.1% | Noticeable reduction | Severe — often halves throughput |
| 1% | Severe | TCP effectively unusable for bulk transfer |
Finding the loss
The critical distinction is between loss on the transport path and loss on the radio. Radio-layer loss is handled by HARQ and RLC retransmission and largely never reaches TCP; if you see loss at the IP layer, it is almost certainly transport or beyond. Test hop by hop rather than end to end, because an end-to-end measurement tells you loss exists without telling you where.
The radio-layer retransmission that hides loss from TCP is worth understanding before interpreting these numbers — HARQ and how retransmission extracts value from failed attempts covers the mechanism, and Module 4 of this course covers how to read the retransmission counters on the radio side.
Triage steps
- Measure loss hop by hop, not end to end. The hop where the rate first rises is the source.
- Distinguish between loss in each direction. Uplink and downlink can differ substantially and often have different causes.
- Check whether loss correlates with load. Loss under congestion is a capacity problem; constant loss regardless of load is usually a physical or configuration fault.
- Compare a UDP throughput test against a TCP one. UDP does not back off on loss, so a large gap between the two confirms that loss is what is limiting TCP.
Part 6 — Buffering, bufferbloat and the QoS interaction
Excessive buffering produces the opposite of the loss problem and is diagnosed differently. A hop with very large queues absorbs congestion rather than dropping packets, which sounds desirable and is not.
TCP relies on loss as its congestion signal. When a router buffers instead of dropping, TCP receives no signal, keeps increasing its sending rate, and the queue grows. Latency rises steeply, throughput becomes erratic, and interactive traffic on the same path becomes unusable while a bulk transfer is running. This is bufferbloat.
The signature
- Round-trip time rises sharply the moment a large transfer starts, then falls back when it finishes.
- Throughput is erratic rather than consistently low — it sawtooths.
- Latency-sensitive applications degrade badly while bulk traffic runs, even though there is nominally enough capacity for both.
The fix is queue management on the offending hop rather than more capacity. Adding bandwidth to a bufferbloated path frequently makes no difference, because the problem is queue depth, not throughput.
Where QoS is configured correctly this should not arise, because latency-sensitive flows are given their own treatment — QoS and 5QI covers the standardized table and what each 5QI actually commits the network to. A bufferbloat symptom on a path that has QoS configured usually means the QoS marking is being lost somewhere on the transport hops.
Part 7 — How to test the transport path properly
Most transport investigations fail on measurement rather than analysis. A speed test to a public server measures the radio, the transport, the internet and the far-end server all at once, and tells you almost nothing about which of them is the constraint.
Test in segments
- gNB to the first hop router. Isolates the fronthaul or backhaul first link.
- gNB to the UPF. This is the GTP-U path and the segment most transport faults live on.
- UPF to the internet breakout. The N6 side.
- End to end, to a known-good server. Only meaningful once the segments above are clean.
Test with the right tool
| What you need | Use | Why |
| Raw path capacity | UDP throughput test | Does not back off on loss, so it measures the link rather than TCP’s reaction to it |
| Realistic user experience | TCP, multiple streams | Matches what applications actually do |
| Path MTU | Ping with DF set, increasing size | The only reliable way to find the real limit |
| Loss and latency per hop | Hop-by-hop measurement | End-to-end tells you a problem exists, not where |
Run every test in both directions. Uplink and downlink take different paths through some networks and are constrained by different things, and a downlink-only test will miss an uplink fault entirely. The uplink is also constrained on the radio side for reasons that have nothing to do with transport — massive MIMO and beamforming covers why array gain benefits the downlink far more than the uplink, which is worth ruling out before blaming a transport hop.
Part 8 — Counters and where to look in 5G transport troubleshooting
The RAN and core counters that matter here are thin, because the transport network is not instrumented by the mobile network. Most of the evidence comes from the transport equipment itself.
| Where | What to collect | What it tells you |
| gNB transport interface | Speed, duplex, errors, drops | The first hop, and the one the RAN team can see |
| Each transport hop | Interface counters, queue depth, discards | Where loss and congestion originate |
| UPF | N3 and N6 throughput, packet counts | Whether traffic is arriving and leaving as expected |
| PFCP / N4 | Session state, heartbeat status | Whether the user plane is programmed at all |
| End to end | RTT, jitter, loss, path MTU | The composite the user actually experiences |
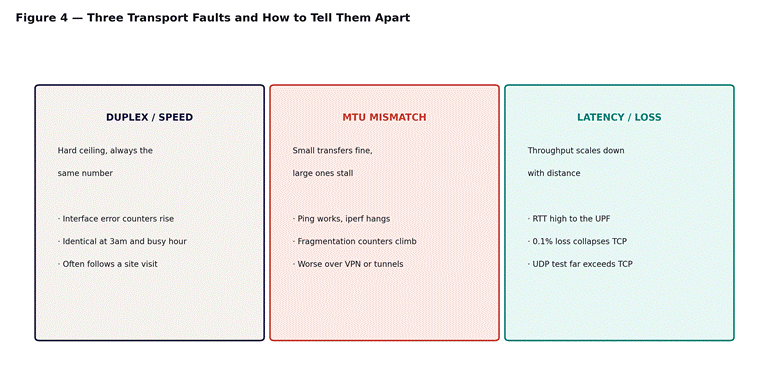
Figure 4 — the three transport faults and the signatures that separate them.
The N4 row is worth repeating from Module 3 because it produces a symptom nothing else does. If the PFCP session between SMF and UPF has failed, the control plane can be entirely healthy — RRC connected, PDU session established, every signaling counter green — and no traffic flows at all. Check PFCP heartbeats before spending a day on the radio when a session looks alive but carries nothing.
Part 9 — Worked example
A logistics customer with twelve sites reports that four of them get roughly 60 Mbps against 400 at the other eight. All twelve are on the same configuration, the same device models, and comparable radio conditions. Two rounds of radio optimization have produced no change.
Module 4’s method rules out the radio quickly. SINR is above 20 dB at all twelve sites, reported rank is 3 to 4, MCS is high, HARQ retransmission is at target, and PRB utilization is under 25 percent. The four slow sites are radio-identical to the eight fast ones.
Part 7’s segmented testing localizes it. A UDP test from the gNB to the UPF returns close to 400 Mbps on all twelve sites, which rules out raw path capacity. A TCP test returns 60 Mbps on the four and 400 on the eight. UDP fast and TCP slow is the signature of either loss or latency, not capacity.
Latency is the answer. Round-trip time to the UPF is 8 milliseconds at the eight healthy sites and 47 milliseconds at the four slow ones. Applying Part 4’s arithmetic, a 47 millisecond round trip with the client’s default window produces a ceiling almost exactly at the observed 60 Mbps.
The root cause is UPF anchoring. Those four sites sit in a tracking area whose SMF configuration anchors sessions to a UPF in a different city, while the other eight anchor locally. Nothing is broken; a configuration decision made during a capacity expansion sent a subset of traffic on a much longer path.
The fix is an SMF configuration change to anchor those sites locally. No radio work, no transport upgrade, no additional capacity — and no amount of tilt optimization would ever have found it, because the constraint was three hundred kilometers away from the cell.
Part 10 — The full decision tree
Step 1 — Confirm the radio is not the constraint
- Work Module 4’s method first. Rank, MCS, HARQ and PRB utilization all healthy is the entry condition for this module.
- Confirm PRB utilization is low. If the cell is congested, that is a capacity problem and belongs in Module 4.
Step 2 — Look for a hard ceiling
- Is the number identical at all hours and under all conditions? If yes, check interface speed and duplex on every hop before anything else.
- Does throughput plateau at a suspiciously round figure? Check AMBR before assuming transport.
Step 3 — Separate the three transport faults
Use Figure 4. A hard unchanging ceiling with interface errors is speed or duplex. Small transfers working while large ones stall is MTU. Throughput that scales down with distance, with UDP far exceeding TCP, is latency or loss.
Step 4 — Test in segments, not end to end
gNB to first hop, gNB to UPF, UPF to breakout, then end to end. An end-to-end test that comes back slow tells you nothing you did not already know.
Step 5 — Do the arithmetic before changing anything
Calculate the theoretical TCP ceiling from measured RTT and window size. If observed throughput is close to that number, latency is the whole story and no other investigation is warranted. This single calculation resolves a large share of transport tickets and takes under a minute.
Step 6 — One change, then re-measure
Transport changes affect every service on the path, not just the one being investigated. Change one thing, re-measure over a full busy hour, and confirm against the customer’s original complaint rather than against the counter you changed.
What comes next
Module 6 completes fault class C with the core and policy side — QoS flow mapping, session-AMBR and slice-level rate limits, UPF load, and the policy decisions that throttle traffic while every radio and transport counter looks healthy. If you need the underlying architecture, the 14-module Introduction to 5G course covers the air interface and core design this course assumes, including the CU/DU/RU split that determines which transport segment is fronthaul and which is backhaul.