

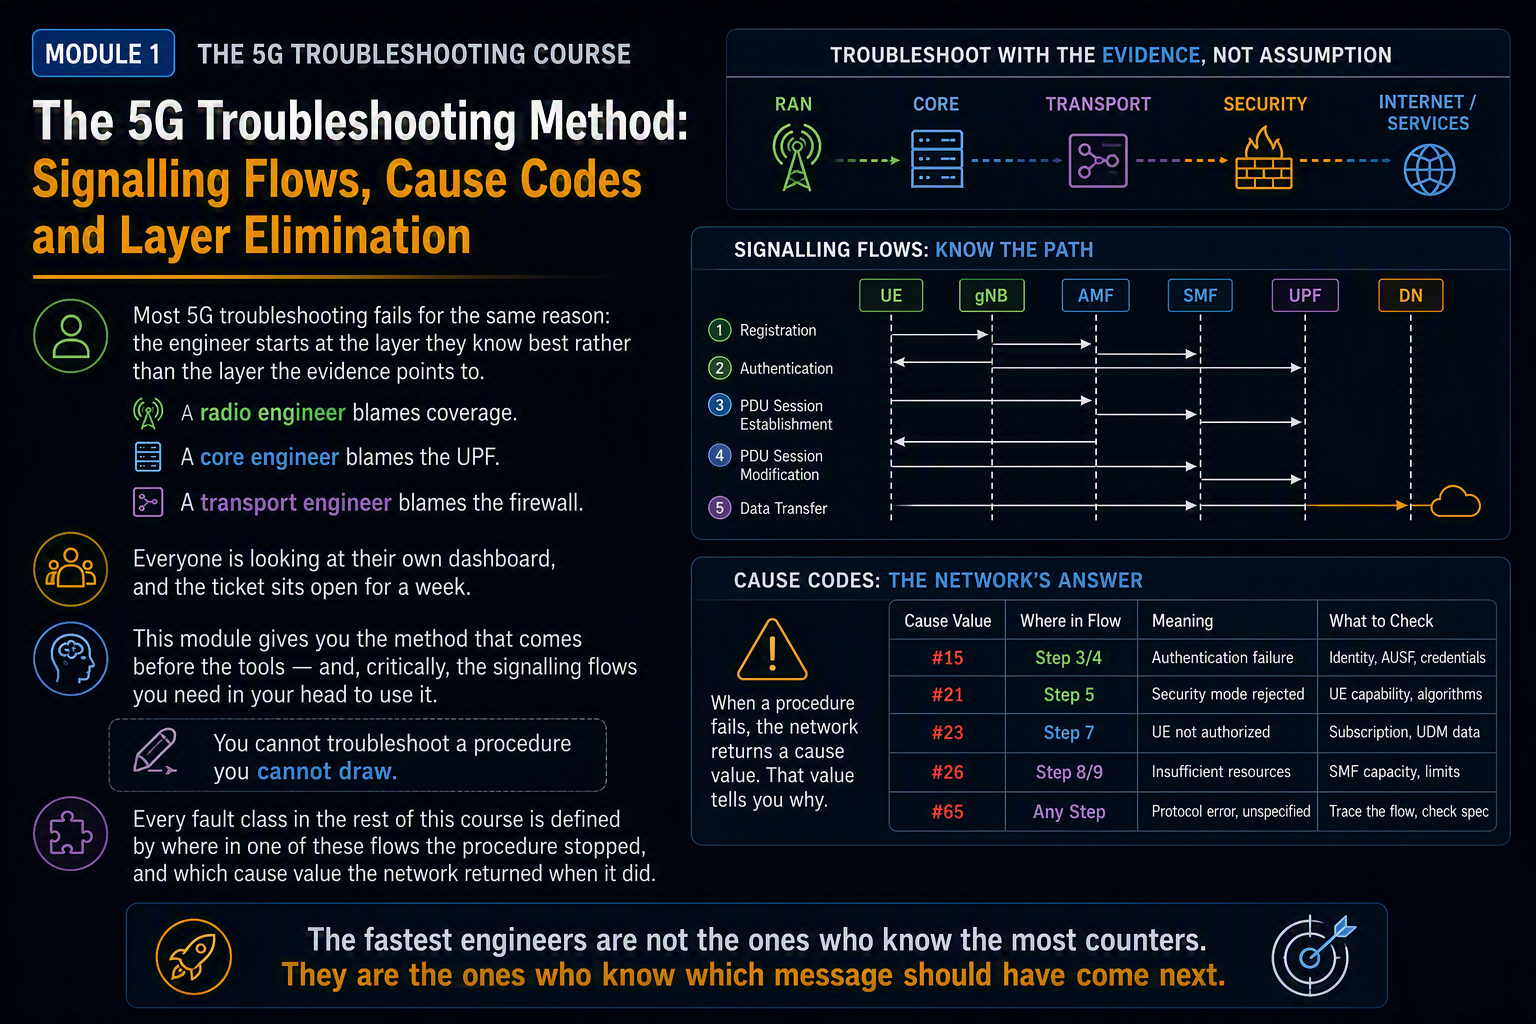
Most 5G troubleshooting fails for the same reason: the engineer starts at the layer they know best rather than the layer the evidence points to. A radio engineer blames coverage. A core engineer blames the UPF. A transport engineer blames the firewall. Everyone is looking at their own dashboard, and the ticket sits open for a week.
This module gives you the method that comes before the tools — and, critically, the signaling flows you need in your head to use it. You cannot troubleshoot a procedure you cannot draw. Every fault class in the rest of this course is defined by where in one of these flows the procedure stopped, and which cause value the network returned when it did.
The fastest engineers are not the ones who know the most counters. They are the ones who know which message should have come next.
In this module
- Part 1 — Classify before you diagnose
- Part 2 — The registration signaling flow
- Part 3 — Reading 5GMM and 5GSM cause values
- Part 4 — The PDU session establishment flow
- Part 5 — Step-by-step: the general triage procedure
- Part 6 — Step-by-step: low throughput triage
- Part 7 — The handover flow, and where drops come from
- Part 8 — Worked example
- Part 9 — Build your baselines before you need them
Part 1 — Classify before you diagnose
Before you open a single counter, put the problem into one of four classes. This single step removes more wasted effort than any other habit, because the four classes have almost no diagnostic overlap.
| Class | Symptom | Where the procedure stops |
| A | Cannot connect at all | RACH, RRC setup, or NAS registration |
| B | Connects, then drops | RLF, handover failure, or PDU session release |
| C | Connected but slow | Completes fully; problem is throughput, not signaling |
| D | Works, but wrong treatment | Completes; QoS flow or slice mapping is incorrect |
Get this classification from evidence, not from the reporter. “It’s slow” frequently turns out to be Class B — a drop-and-reconnect cycle that the user experiences as slowness. Ask what the device shows, whether the problem is continuous or intermittent, and whether it survives a reboot. A device that recovers on reboot but not on cell reselection is telling you something specific.
Establish scope before you establish cause
Scope is the second filter and more powerful than most engineers treat it. How many things are affected, and what do they have in common?
| Scope | Almost certainly | Almost certainly not |
| One device, one cell | Device, SIM, subscription, coverage | Core, policy, transport |
| Many devices, one site | Site config, hardware, transport | Device, subscription |
| One device model, network-wide | Firmware, capability negotiation | Radio, coverage |
| One DNN / slice / enterprise | Policy, QoS, SMF or UPF config | Radio |
| Everything, everywhere | Core NF, DNS, change window | Individual cells |
Scope tells you which layer owns the problem before you look at a single KPI. A fault affecting one device model across the entire network is not a radio problem no matter how bad that device’s SINR looks, and no amount of RF optimisation will fix it.
Part 2 — The registration signaling flow
Class A faults are almost always a failure inside this flow. Learn it as a sequence of checkpoints: every step is a place the procedure can stop, and each stopping point produces a different symptom.
The full ladder, standalone 5G
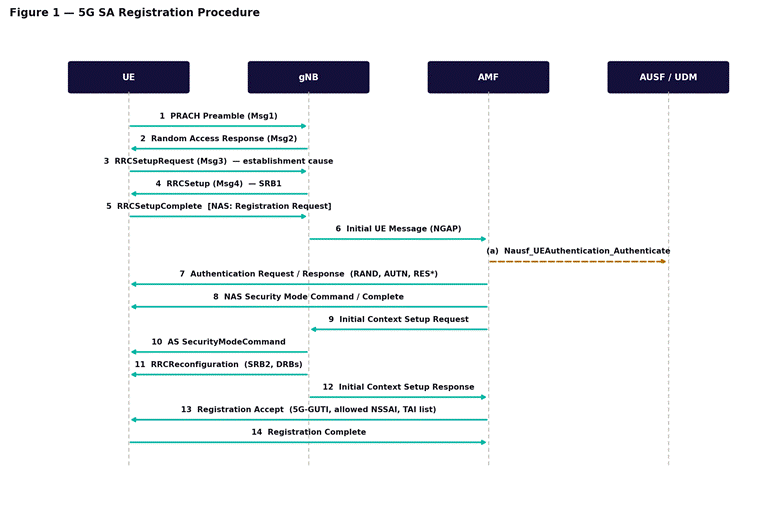
Figure 1 — 5G SA registration, UE through to Registration Complete. Steps 1–5 are RAN-only; the NAS procedure rides inside RRCSetupComplete at step 5. Step numbers correspond to the table below. The dashed call marked (a) is the AMF’s service-based request to AUSF and is not a numbered step.
| # | Message | Direction | Purpose |
| 1 | PRACH preamble (Msg1) | UE → gNB | Random access, timing advance request |
| 2 | Random Access Response (Msg2) | gNB → UE | TA, UL grant, temporary C-RNTI |
| 3 | RRCSetupRequest (Msg3) | UE → gNB | Connection request with establishment cause |
| 4 | RRCSetup (Msg4) | gNB → UE | SRB1 configured, contention resolved |
| 5 | RRCSetupComplete | UE → gNB | Carries the NAS Registration Request |
| 6 | Initial UE Message | gNB → AMF | NGAP; AMF selected via 5G-S-TMSI or NSSAI |
| 7 | Authentication Request/Response | AMF ↔ UE | 5G-AKA challenge, RES* verification |
| 8 | Security Mode Command/Complete | AMF ↔ UE | NAS ciphering and integrity activated |
| 9 | Initial Context Setup Request | AMF → gNB | Security context, UE capabilities, AMBR |
| 10 | SecurityModeCommand (AS) | gNB → UE | AS-layer security activated |
| 11 | RRCReconfiguration | gNB → UE | SRB2 and any DRBs configured |
| 12 | Initial Context Setup Response | gNB → AMF | Context established |
| 13 | Registration Accept | AMF → UE | 5G-GUTI, allowed NSSAI, TAI list |
| 14 | Registration Complete | UE → AMF | GUTI acknowledged |
Steps 1 and 2 are where a surprising number of “no service” complaints actually originate, and preamble planning is the usual culprit in dense deployments — the RACH preamble planning guide covers root sequence allocation and collision behaviour in detail. For the synchronisation and cell-search steps that precede Msg1, see NR initial access — cell search, SSB and random access.
Where it stops, and what you see
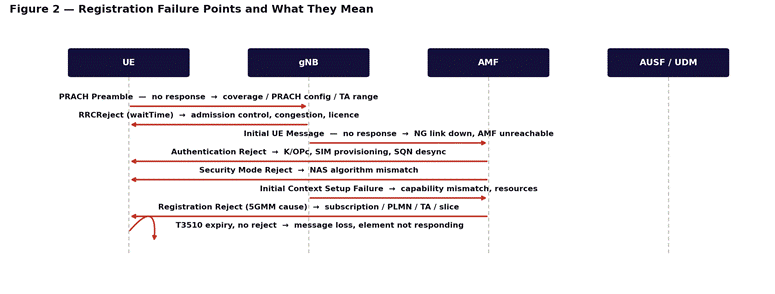
Figure 2 — the same registration procedure, annotated with where it fails and what each stopping point means.
| Stops at | Symptom | Most likely cause |
| 1–2 | UE never leaves idle; no RRC attempt logged | Coverage, PRACH config mismatch, preamble collision, TA out of range |
| 3–4 | RRCSetupRequest with no RRCSetup, or RRCReject | gNB admission control, congestion, licence limits |
| 5–6 | RRC connects then releases immediately | AMF unreachable, NG interface down, NSSAI not supported |
| 7 | Authentication Reject | Wrong K/OPc, SIM provisioning, sequence number desync |
| 8 | Security Mode Reject | Algorithm mismatch between UE and network |
| 9–12 | Registration stalls after security | Context setup failure, capability mismatch, resource exhaustion |
| 13 | Registration Reject with 5GMM cause | Subscription, PLMN, TA restriction, slice unavailable |
Timers you should recognise
T3510 15 s Registration Request sent, waiting for Accept or Reject
T3502 12 min Backoff after registration attempt counter reaches 5
T3511 10 s Retry timer after a failed registration
T300 varies RRC connection establishment; expiry = RRC setup failure
T3580 16 s PDU session establishment, waiting for Accept
A UE cycling on T3510 expiry with no reject message is a very different fault from a UE receiving an explicit Registration Reject. The first means messages are being lost or an element is not responding; the second means an element made a decision. Distinguishing those two is often the whole investigation.
Part 3 — Reading 5GMM and 5GSM cause values
5G is unusually generous with explicit failure reasons. A counter tells you how often something failed; a cause value tells you why. Always read the cause first.
5GMM causes — registration and mobility
| Cause | Meaning | What to check |
| #3 | Illegal UE | IMSI/SUPI not provisioned or authentication permanently failed in UDM |
| #6 | Illegal ME | IMEI blacklisted in EIR |
| #7 | 5GS services not allowed | Subscription lacks 5G; check UDM access restriction data |
| #11 | PLMN not allowed | Roaming agreement, forbidden PLMN list on the UE |
| #12 | Tracking area not allowed | TAI not in subscribed TA list |
| #13 | Roaming not allowed in this TA | Regional subscription restriction |
| #15 | No suitable cells in TA | Cell barred, or TA misconfiguration on the gNB |
| #22 | Congestion | AMF overload control active; check NAS back-off timers |
| #31 | Redirection to EPC required | SA not supported for this subscriber; expected on some devices |
| #62 | No network slices available | NSSAI mismatch between UE, gNB and AMF |
5GSM causes — PDU session establishment
| Cause | Meaning | What to check |
| #26 | Insufficient resources | UPF or SMF capacity; often transient under load |
| #27 | Missing or unknown DNN | DNN not provisioned, or typo in the APN on the device |
| #28 | Unknown PDU session type | IPv4/IPv6/Ethernet mismatch between UE request and subscription |
| #29 | User authentication failed | Secondary authentication against an enterprise AAA |
| #33 | Requested service option not subscribed | Subscription does not include this DNN or slice |
| #38 | Network failure | Generic SMF-side failure; escalate with the SMF trace |
| #46 | Out of LADN service area | Local Area Data Network geofence; expected behaviour |
| #67 | Insufficient resources for specific slice and DNN | Slice quota exhausted for this DNN |
| #69 | Insufficient resources for specific slice | Slice-level admission control triggered |
Causes #67 and #69 are the ones that turn up in enterprise tickets and get misread as radio problems, because the customer sees “no data” while every radio KPI is healthy. If slice admission control is new to you, network slicing — one physical network, many virtual ones covers how the quotas are enforced, and QoS and 5QI covers what happens to traffic once the session is up.
Three rules for cause values
- A cause from the network is authoritative; a cause inferred from timing is not.
- Aggregate before acting. One reject is noise; a thousand with the same cause is a configuration fault.
- Correlate with time. A cause distribution that changed at 02:00 on a Tuesday points at a change window, not at the radio.
The same interpretive discipline applies on the LTE side of any non-standalone deployment — the detach cause analysis in LTE and the basic LTE call flow transfer almost directly, since EN-DC anchors on the LTE control plane.
Part 4 — The PDU session establishment flow
Registration gets the UE known to the network. It does not give it data. Class C and D faults frequently trace to this second procedure, which many engineers skip over because it usually just works.
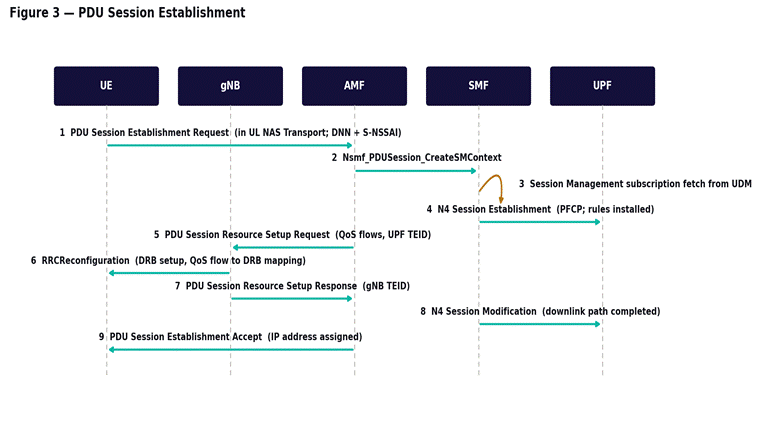
Figure 3 — PDU session establishment. Steps 4 and 8 are the N4/PFCP exchanges that no radio counter will ever show you. Step numbers correspond to the table below.
| # | Message | Direction | Purpose |
| 1 | PDU Session Establishment Request | UE → AMF | Inside UL NAS Transport; carries DNN and S-NSSAI |
| 2 | Nsmf_PDUSession_CreateSMContext | AMF → SMF | SMF selected by DNN and slice |
| 3 | Session Management subscription fetch | SMF → UDM | Subscribed QoS, session-AMBR, static IP |
| 4 | N4 Session Establishment | SMF → UPF | PFCP; forwarding and QoS rules installed |
| 5 | PDU Session Resource Setup Request | AMF → gNB | QoS flow list, UPF tunnel endpoint |
| 6 | RRCReconfiguration | gNB → UE | DRB established, QoS flow to DRB mapping |
| 7 | PDU Session Resource Setup Response | gNB → AMF | gNB tunnel endpoint returned |
| 8 | N4 Session Modification | SMF → UPF | Downlink path completed |
| 9 | PDU Session Establishment Accept | AMF → UE | IP address assigned |
Note step 4. The N4 interface is where the control plane instructs the user plane, and it is invisible to every radio counter you own. A session that completes signaling but carries no traffic is very often an N4 or GTP-U problem, and no amount of radio investigation will reveal it.
This is the practical reason to understand control and user plane separation before troubleshooting data faults, and to know which function owns which step — the AMF, SMF and UPF breakdown maps each message above to the element that generates it.
Part 5 — Step-by-step: the general triage procedure
When a ticket lands, work these steps in order. Do not skip ahead, and do not change a parameter until step 9.
- Classify the fault into class A, B, C or D using the table in Part 1. Write the class on the ticket.
- Establish scope. Count affected devices, cells, DNNs and device models. Identify what they share.
- Ask what changed and when. Parameter push, software upgrade, neighbour relation, firewall rule, certificate expiry. Align the fault start time against the change log before anything else.
- Pull the cause values. For class A, get the 5GMM or 5GSM cause from the AMF or SMF logs. For class B, get the RRC release cause and any RLF report.
- Locate the stopping point in the relevant signaling flow from Part 2 or Part 4. Name the exact message that did not arrive.
- Prove the radio layer healthy or not: RSRP, RSRQ, SINR, reported rank, CQI distribution, BLER, HARQ retransmission rate. If the radio is unhealthy, stop here and fix it — everything above will produce misleading symptoms.
- Prove the transport layer: interface speed and duplex, error counters, MTU end to end, latency and jitter to the UPF. A backhaul negotiating at the wrong rate looks exactly like a radio problem on a speed test.
- Prove the core and policy layer: QoS flow mapping, session-AMBR, slice quota, UPF load, N4 session state.
- Only now identify the mechanism and make one change. One change, then re-measure.
- Confirm against the original symptom, not against the KPI. A KPI that improves while the complaint stays open means you fixed a symptom, not a mechanism.
Part 6 — Step-by-step: low throughput triage
Class C is the most commonly misdiagnosed fault type, because throughput is the KPI radio teams own and therefore the first place everyone looks. Work it in this order instead.
Stage 1 — Establish the ceiling
- Confirm the theoretical maximum for this configuration: bandwidth, numerology, MIMO layers, modulation order, TDD pattern. Compare the observed throughput against that number, not against a neighbouring cell.
- Check whether the UE is capable of the configuration you are assuming. A device limited to 2 layers will never reach a 4-layer figure regardless of the network.
- Check the subscribed session-AMBR and UE-AMBR. If throughput plateaus at a suspiciously round number, this is almost always why.
Stage 2 — Radio
- Check SINR and reported rank together. Good SINR with rank 1 means a spatial problem, not a coverage problem.
- Check the CQI distribution and the resulting MCS. A collapsed MCS with good SINR indicates outer-loop link adaptation reacting to BLER.
- Check HARQ retransmission rate. Sustained high retransmission means the link adaptation target is not being met.
- Check PRB utilisation on the cell. A congested cell is a scheduling problem, not a link problem, and the fix is capacity rather than optimisation.
Rank collapse is the single most misread symptom in this stage: the antenna environment drives it, not the link budget, so a coverage fix will not recover it. Massive MIMO and beamforming covers how spatial layers behave in NR and why rank falls when the scattering environment changes.
Stage 3 — Transport
- Verify interface speed and duplex on every hop between the gNB and the UPF. Auto-negotiation failures are common and silent.
- Test end-to-end MTU with fragmentation disabled. GTP-U encapsulation overhead makes 1500-byte MTU assumptions wrong more often than engineers expect.
- Measure latency and jitter to the UPF, then to the internet breakout. TCP throughput is bounded by window size divided by round-trip time, so latency alone can cap throughput with zero packet loss.
- Check for packet loss on the transport path. Even 0.1 percent loss will collapse TCP throughput on a long path.
Stage 4 — Core and policy
- Verify the QoS flow the traffic actually mapped to, not the one you expect. Check the 5QI, the ARP and the flow-to-DRB mapping in the RRCReconfiguration.
- Check slice-level quotas and any enforced rate limits for the DNN.
- Check UPF load and whether the session is anchored to the expected UPF. A session anchored to a distant UPF adds latency that looks like a radio problem.
Stage 5 — Application
- Test with a different server and a different protocol before concluding the network is at fault.
- Check TCP congestion control behaviour and window scaling on the client. A single-stream test can understate available capacity substantially.
Part 7 — The handover flow, and where drops come from
Class B faults — connects then drops — are usually one of two things: radio link failure on a stationary UE, or handover failure on a moving one. The handover procedure has its own timer, T304, and its expiry is the single most useful signal in a drop investigation.
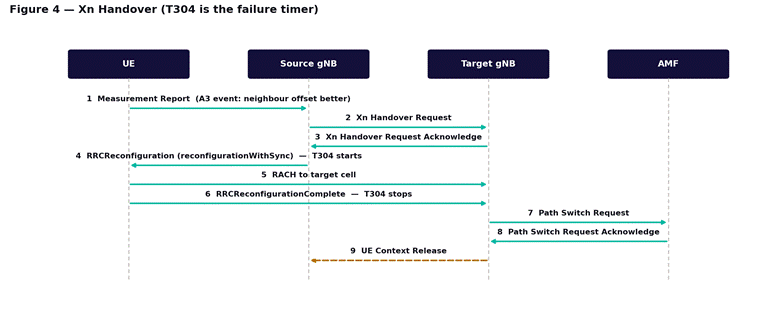
Figure 4 — Xn-based handover. T304 starts at step 4 and stops at step 6; expiry means the UE never reached the target cell.
Three failure signatures are worth memorising. Too-late handover: RLF on the source before the measurement report is acted upon — the UE was already out of coverage when the decision was made. Too-early handover: successful handover followed immediately by a return to the source, meaning the target was a transient peak. Wrong-cell handover: the UE lands on a cell that is neither source nor the intended target, which points at neighbour relation or PCI confusion.
Radio link failure behaviour on the LTE side follows the same T310/T311/N310/N311 logic and is worth reading if these timers are unfamiliar — see radio link failure in LTE. For handover in NR specifically, including the conditional variant that changes this flow substantially, see conditional handover in 5G NR and mobility and handover — Xn, N2 and session continuity.
Part 8 — Worked example
A corporate customer reports that one site delivers 80 Mbps where neighbouring sites deliver 400. Radio counters look healthy: SINR above 20 dB, rank 2 to 3, HARQ retransmission within normal range, PRB utilisation low. The obvious conclusion is that the radio has a problem the counters are missing.
Working the procedure: class C, scope is one site with all devices affected, no recent change on the radio side. Stage 1 confirms the configuration should deliver roughly 400 Mbps and the session-AMBR is not the constraint. Stage 2 confirms the radio is healthy — so by the elimination rule, stop and move up rather than optimising further.
Stage 3 finds it. The backhaul interface has negotiated at a lower rate after a maintenance intervention, or an MTU mismatch is causing fragmentation on the GTP-U path. The radio was never the constraint. The symptom pointed at the radio only because throughput is the KPI radio engineers own and the first dashboard anyone opens.
This is why the elimination order matters more than any individual measurement. The correct move was not to optimise the radio harder — it was to prove the radio healthy, leave it alone, and go up a layer.
Part 9 — Build your baselines before you need them
Troubleshooting is comparison. You cannot identify an abnormal value without a baseline, and baselines are network-specific: a dense urban macro cell and a rural cell serving fixed wireless access have completely different normal ranges for the same counters.
For every site you are likely to investigate, record the busy-hour values for registration success rate, PDU session establishment success rate, drop rate, average and cell-edge SINR, average reported rank, PRB utilisation and the throughput distribution. When a ticket arrives, the first useful question becomes “how does this differ from last Tuesday” rather than “is 14 dB SINR good”.
What comes next
Module 2 takes fault class A — registration and attach failures — and works each stopping point in the registration ladder above with real counter values, log extracts and decision trees. Later modules cover session drops and radio link failure, the three families of low-throughput causes, handover failures in standalone and non-standalone deployments, and EN-DC-specific SCG failures. If you need the underlying architecture first, the 14-module Introduction to 5G course covers the air interface and core design this course assumes, including the CU/DU/RU split that determines what “the site is down” actually means in a disaggregated RAN.